Middleware Builder Intro
The Middleware Builder
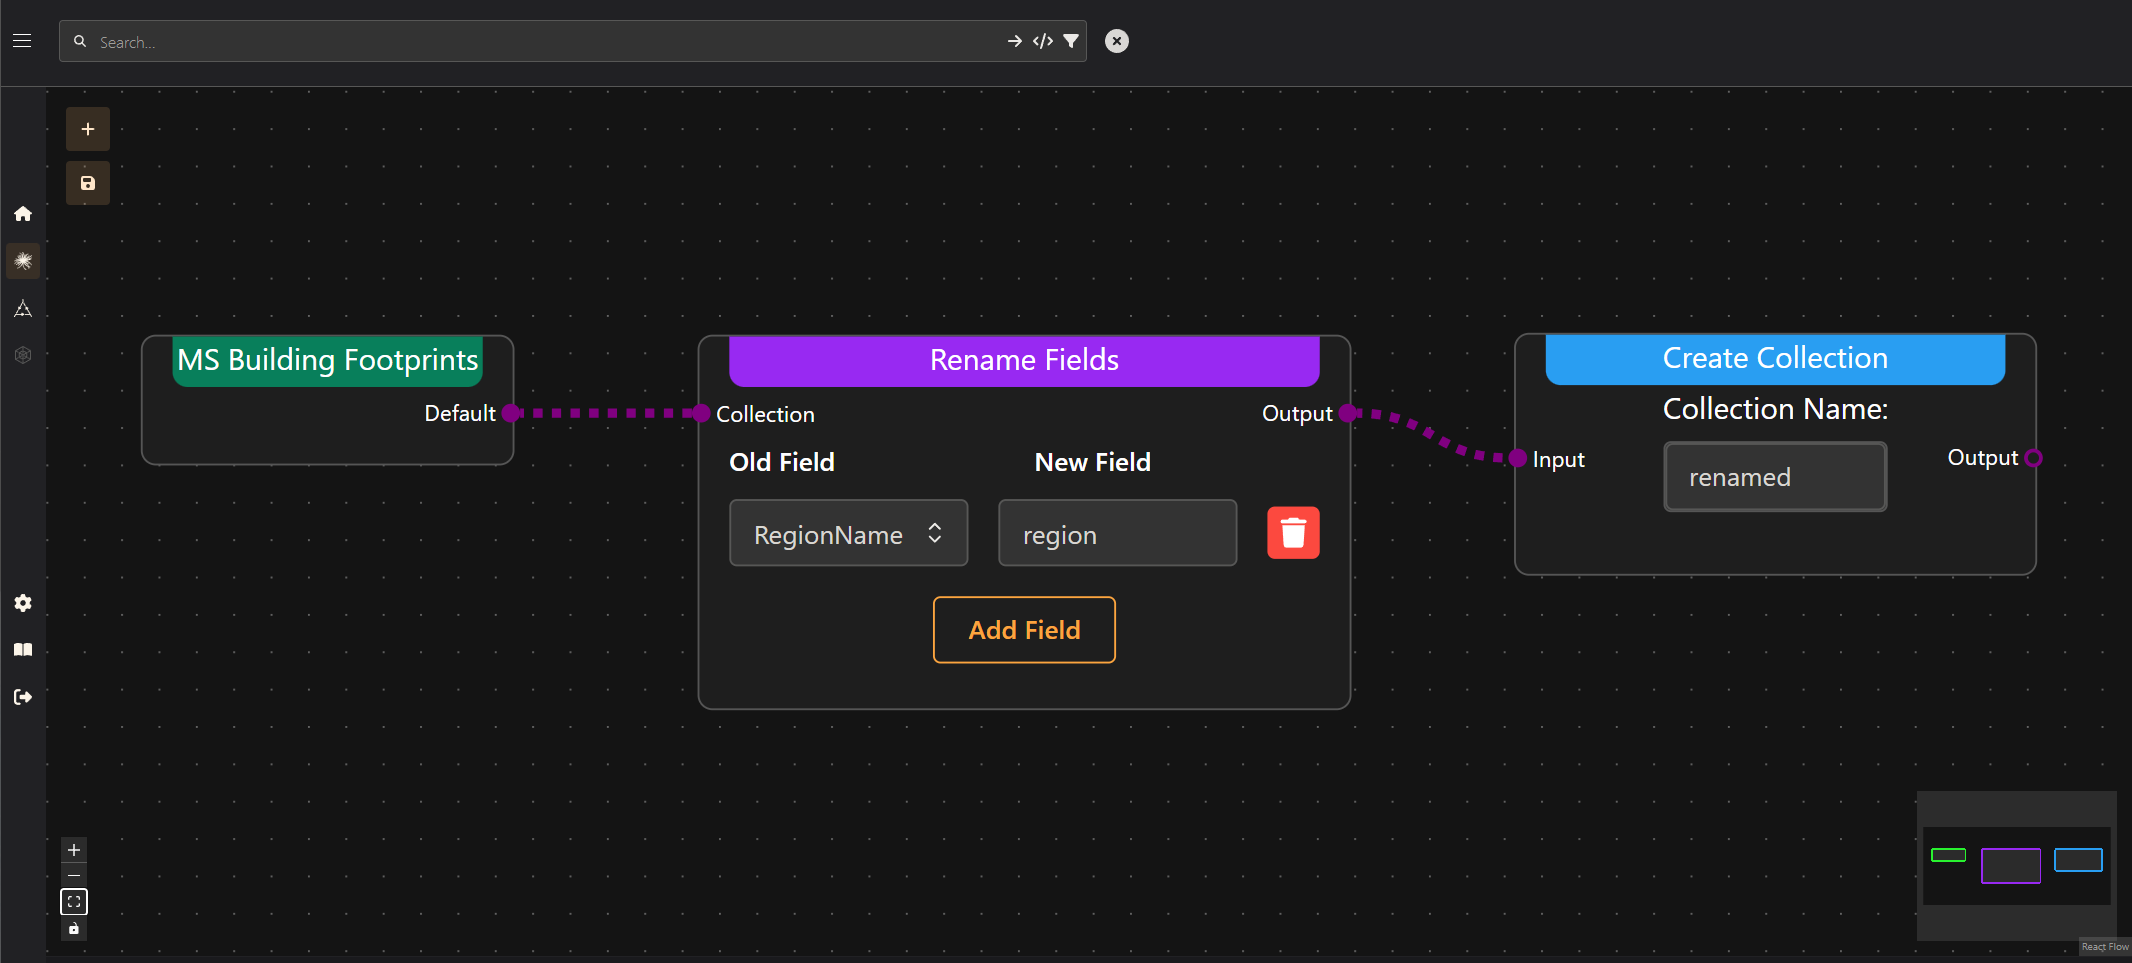
The Geodesic Web App uses a simple, no-code way of configuring Middleware (although this can all be done through code as well if you prefer). The Middleware Builder allows you to create a processing chain by drawing the flow of data that you want. For example:
To open the Middleware Builder go to the Boson page (the menu bar on the left allows you to navigate). On the Boson page, search for the dataset that you want to apply Middleware to and find it in the table. In the actions column click the Middleware Builder button. The top portion of the page will open the builder.
Parts of the Middleware Builder
Canvas
The main portion of the Middleware Builder is the canvas. This is where you will place and connect nodes to define how data flows through the platform.
Canvas Controls
In the lower left hand corner you will see the canvas controls. These allow navigation of the canvas which can be useful for larger flows. These allow you to zoom in and out as well as to fit the flow to the screen.
Canvas Minimap
The minimap found in the lower right hand corner gives you a simplified view of the whole flow. Colored boxes correspond to the different types of nodes found in the flow. Clicking and dragging on the minimap will also navigate around the canvas.
Action Buttons
In the upper left corner of the canvas are the action buttons. The + button on the top is how
you add new nodes to the flow. Underneath that is the save button. This is how to save and push the
Middleware configurations to the server. If there are any problems with the flow, the save
button will be greyed out. Fix any errors to save the flow.
Middleware Nodes
When you first open the Middleware Builder the canvas will be populated with one or more nodes. If no Middleware has been saved on the dataset before, you will only see one node that is the dataset itself. If you open a dataset that already has middleware defined on it, you will see more nodes connected to the dataset node.
In the middle of the node, there may be fields, dropdowns or checkboxes that can be used to modify the behavior of the node. These will be different depending on the type of node as well as what inputs are connected to it.
Nodes can be deleted from the flow by clicking anywhere on the node background or header then clicking the red trash can icon above the node, or by pressing the delete or backspace key.
Input/Output Handles
Nodes will have some number of inputs on the left side, and outputs on the right side. We collectively refer to these inputs and outputs as Handles. These inputs and outputs will be different colors that correspond to which type of data they can be connected to. Purple inputs and outputs are feature data, orange inputs and outputs are asset or pixel data.
There are two different types of asset inputs and outputs. While they are both colored orange, they have a different shape. The round dot represents data that is only a single band of pixel data (the color or band dimension in the array has size 1). The oval represents multi-band data (the color or band dimension in the array has a size greater than 1). Some inputs like those found on Create Asset nodes will have a combination of these two. This means that either multi-band or single band data is allowed to be connected to this node.
The Middleware Builder will not allow you to connect handles that have different types. Or if only one input is allowed, it will not allow more connections beyond the first.
Flow Edges
To determine the flow of data in Middleware you connect nodes together with flow edges. These edges are dotted and will move in the direction that data is flowing. They will also be colored the same as the inputs and outputs they are connected to. Deleting edges can be done by selecting the edge and pressing either the delete or backspace keys.
Types of Middleware Nodes
Dataset Nodes
Dataset nodes are where the data flows out from. They are usually on the left hand side and will be the only node on the flow if no Middleware has been previously saved. The header bar on dataset nodes will always be Green.
Output Nodes
Usually at the very end of a flow you will place output nodes. These nodes always have a blue header. These nodes are how you create an output in the dataset. There are two kinds of output node, Create Asset and Create Collection which create assets (rasters etc...) and collections (features with geometry) respectively. When an output node is added to the flow and saved, that output will now appear when querying the dataset and can be used for analysis or mapping. The flow must always contain at least one output node.
Pixel Transform Nodes
This type of node is used to transform or otherwise modify pixel data. Pixel transform nodes will always have an asset input on the left side that is orange. In general these will also have an orange output on the right hand side.
Feature Transform Nodes
Feature transform nodes are similar to Pixel Transform Nodes except they work on feature collections. Feature collections are tabular data that may or may not have a geometry column. These transformations can act on the schema of the table, perform calculations on the rows, or create new columns. An example of this type of node would be the Rename Fields node which allows renaming of any columns in a feature collection.
Utility Nodes
Nodes that are either used internally to the flow, or that don't transform or create any data are grouped into Utility Nodes. An example of a node that is used internally is the Split Bands node. This node just takes a multi-band output and splits it to show each individual band so that they may be used as inputs to other nodes. This node doesn't effect the data in any way, its just to make selecting individual pieces of data easier to access.
Building a Middleware Flow
A complete Middleware Flow should always have a dataset (automatically added) and at least one
output. Here is an example of a trivial flow where an asset from the dataset node is connected to an
output node. All this does is take the asset called image and create a new asset called new-asset.
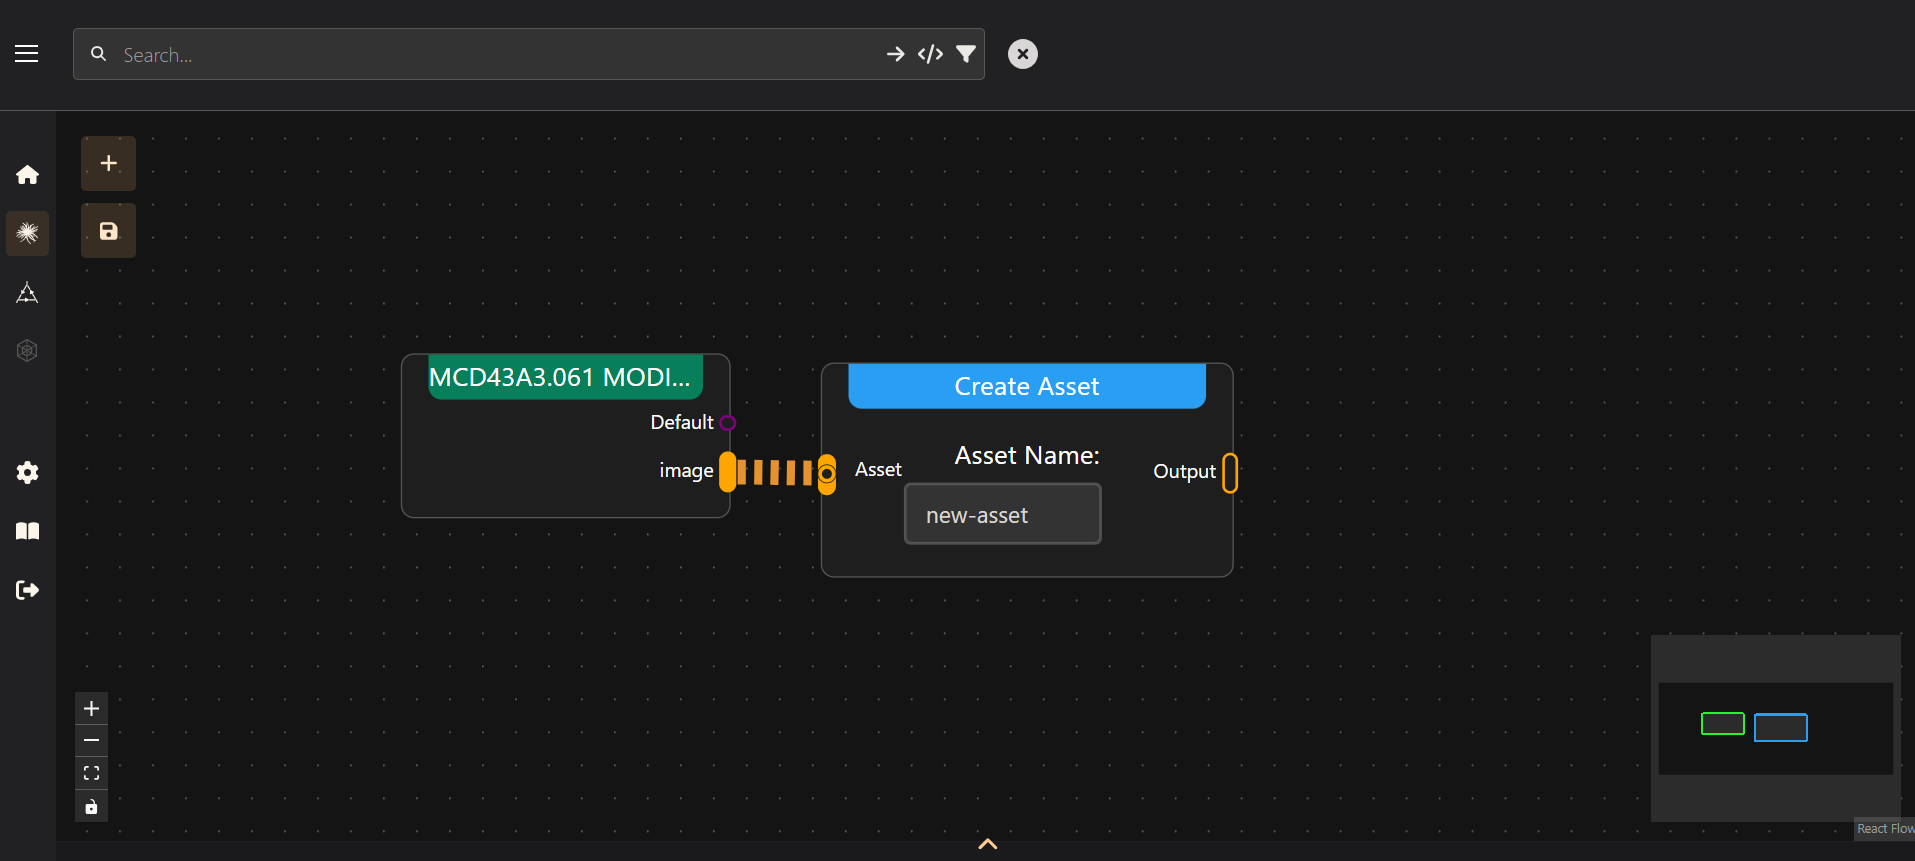 A trivial example of a Middlware Flow.
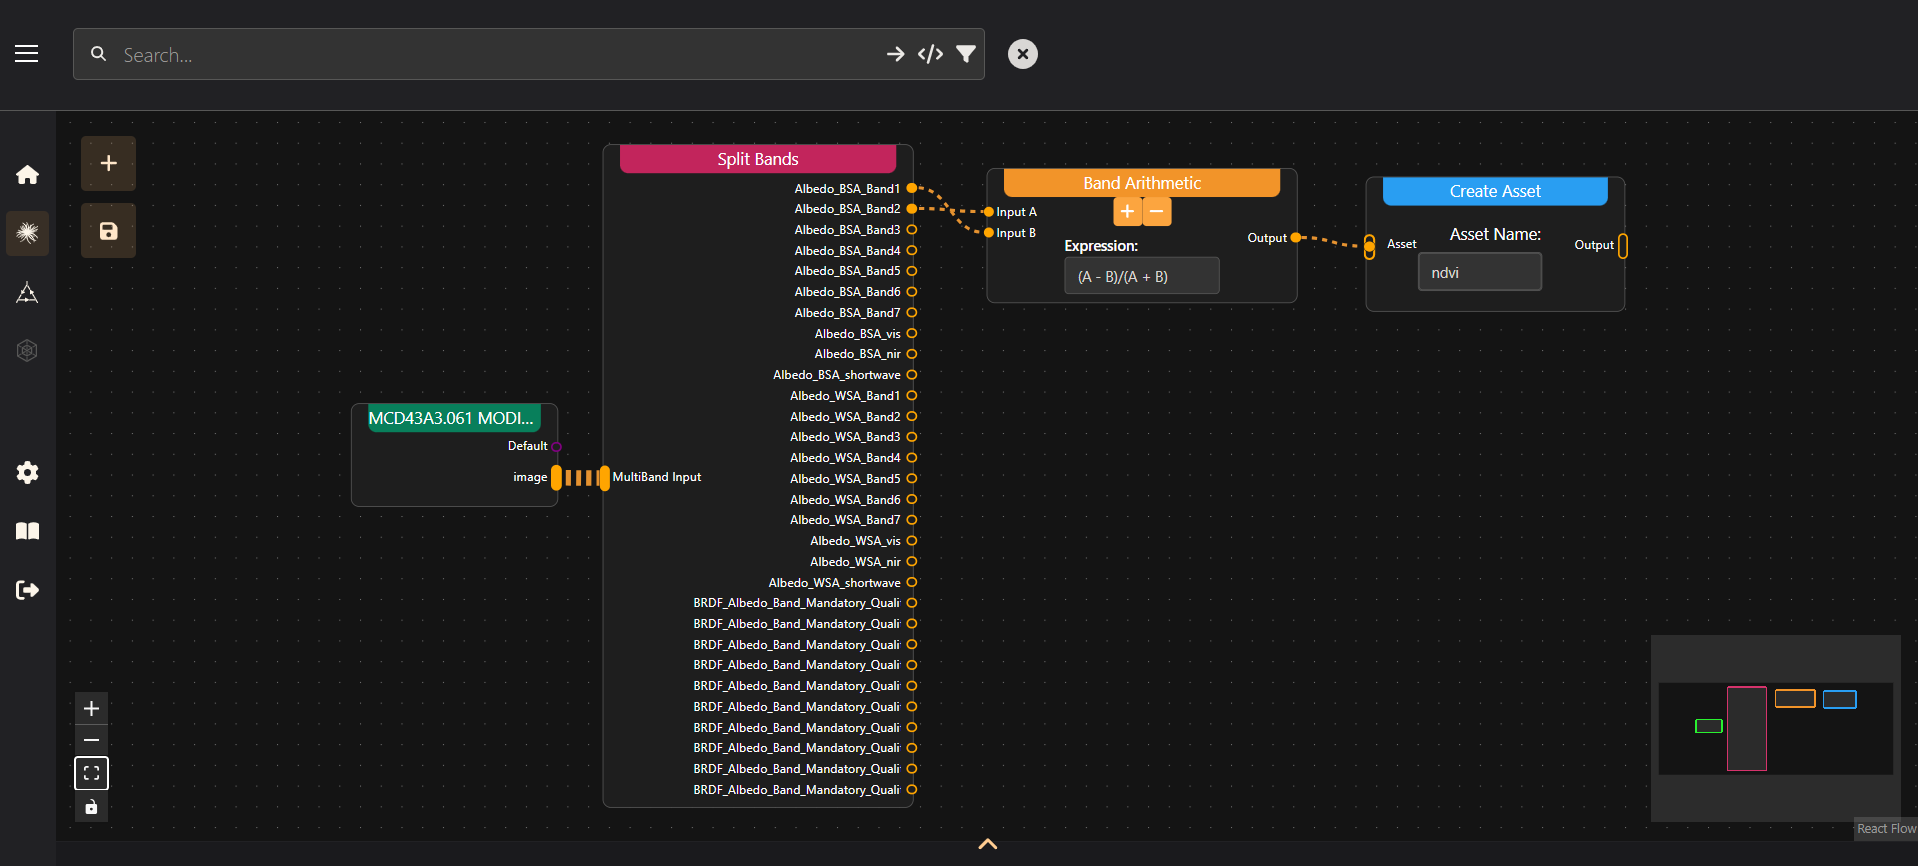
A typical Middleware Flow puts more nodes that perform operations in between the dataset and output nodes. Lets look at doing a simple band arithmetic operation. The classic example is NDVI or the Normalized Difference Vegetation Index. This is a measurement made with satellite or aerial imagery commonly used to estate vegetation health. The way to calculate it is to use the Near IR (NIR) and Red bands in the equation:
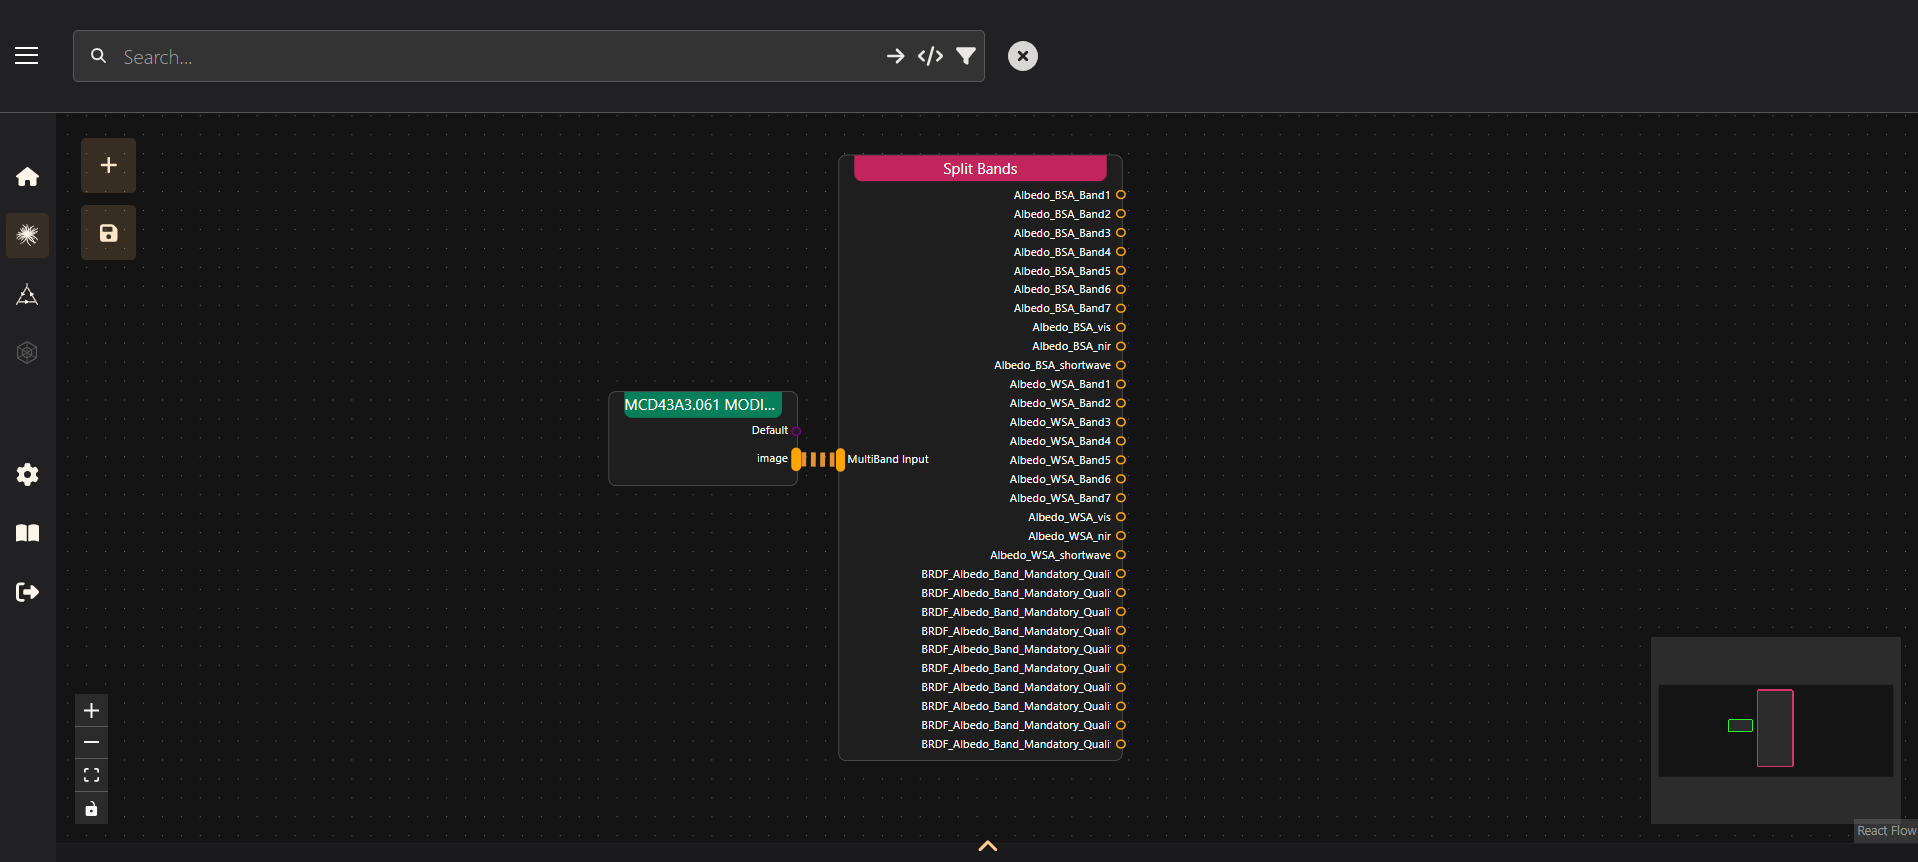
To build this flow, lets first open up the middleware builder for the MODIS dataset. This has two
handles that we can connect, default, which for imagery middleware is the feature collection of
image footprints, and image which is the asset for the actual pixel data.
We first need to split the asset into its individual bands with the split bands node connected to
the image asset.
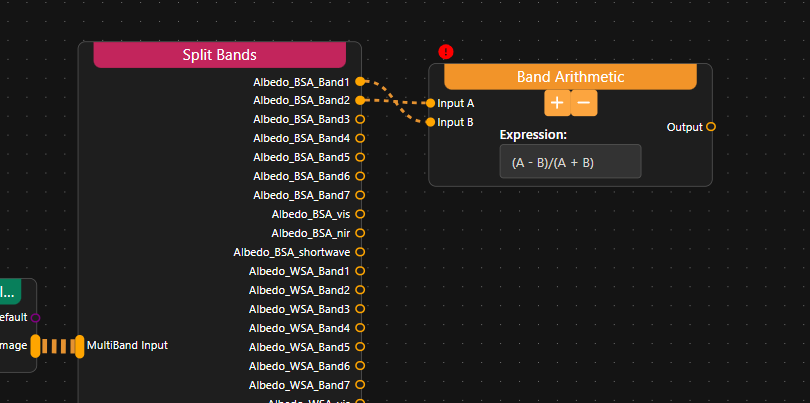
Now we can access the individual bands in the asset. To calculate NDVI we add a Band Arithmetic node
to the canvas. For MODIS, band 1 is Red and band 2 is NIR. Clicking the + button on the Band
Arithmetic node adds another input to the node. We connect band 1 to input B and band 2 to input A
then enter the NDVI expression using A and B for the inputs.
To make the calculated NDVI appear in the dataset when queried we just need to create a new asset to
hold it. Adding a Create Asset node to the flow allows us to connect the output of the Band
Arithmetic node to the input of Create Asset. It also needs a name for the new asset. We will call
it ndvi.
After saving this flow, the Middleware will be configured on that dataset, and the new asset
ndvi will appear on the dataset info. Any queries to this asset will automatically run the data
that is returned through this Middleware Flow and be returned to the client.
Whats Next?
This is all you need to know to get started with building Middleware on datasets in the Geodesic Platform. To find more information about specific Middleware Nodes, check the Middleware Reference section.