Adding A CSV Dataset
In this example, we will be using the US Census Bureau's
Centers of Population
dataset, specifically at the county level. This dataset gives a point location for the population
centroid of each county in the US in a CSV format. Files are available broken down by state, but we
will be using the file for the entire US available at
https://www2.census.gov/geo/docs/reference/cenpop2020/county/CenPop2020_Mean_CO.txt.
For the purposes of this demo, we have a copy of this file saved to a public bucket at
gs://geodesic-public-data/CenPop2020_Mean_CO.csv but you might want to copy this file to your own
cloud storage (e.g., S3 or Google Cloud Storage) to better replicate your use case. If you want to
do this, you can easily substitute the url in the examples with your own cloud storage url.
Setup
First to do some initial setup. We start by importing geodesic:
import geodesic
If you haven't yet, you will need to authenticate geodesic using the following command:
geodesic.authenticate()
This process is covered in more detail in the Quickstart.
We need to set the active project to ensure that our dataset is saved to the correct project. You can fetch a dictionary of existing project that you can access by running
geodesic.account.projects.get_projects. If you are the owner of the project you want to use, you can set the active project by passing its name to geodesic.account.projects.set_active_project. If you are not the owner of the project, you will need to set the active project by passing the uid instead. Note that you will also need read and/or write permissions for the project in question. Finally, if you want to create a new project, you can do so by running:
proj = geodesic.create_project(
            name="tutorials",
            alias="tutorial Demos Project",
            description="Project to hold demos and examples for our tutorial doc pages",
            set_as_active=True,
        )
Creating The Provider
The geodesic python API provides a method,
geodesic.boson.dataset.Dataset.from_csv, which makes adding a CSV dataset extremely straightforward. To add our population centers dataset, we simply run:
ds = geodesic.Dataset.from_csv(
    name='uscb-pop-centers',
    url='gs://geodesic-public-data/CenPop2020_Mean_CO.csv',
    index_data=True,
    crs='EPSG:4326',
    x_field='LONGITUDE',
    y_field='LATITUDE'
)
ds.save()

#output:
dataset:*:*:*:uscb-pop-centers
The geodesic.boson.dataset.Dataset.from_csv method can also be used with
non-geospatial data. You can simply leave out the x_field and y_field arguments if they are not
present in your dataset.
Testing The Provider
Now to run a quick test to ensure that the provider is working. Let's search run a simple search to check that features are returned
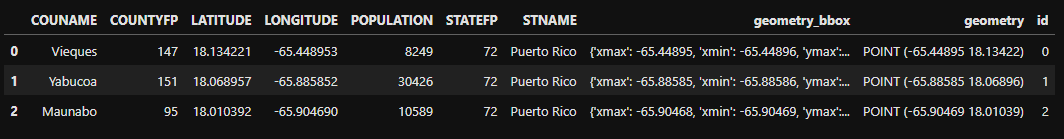
ds.search(limit=3)
This will return the first three features from the CSV in a geopandas GeoDataFrame.
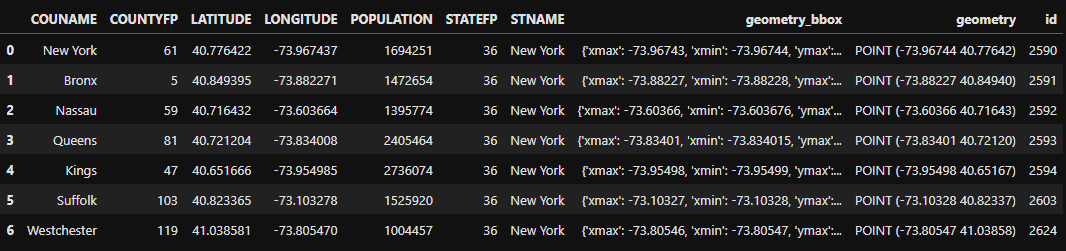
As a slightly less trivial example, let's search for the counties in New York state with populations greater than one million:
from geodesic import cql
feats = ds.search(
    limit=10,
    filter=cql.CQLFilter.logical_and(
        cql.CQLFilter.eq('STNAME', 'New York'),
        cql.CQLFilter.gte('POPULATION', 1000000)
    )
)
feats
This should return seven features:
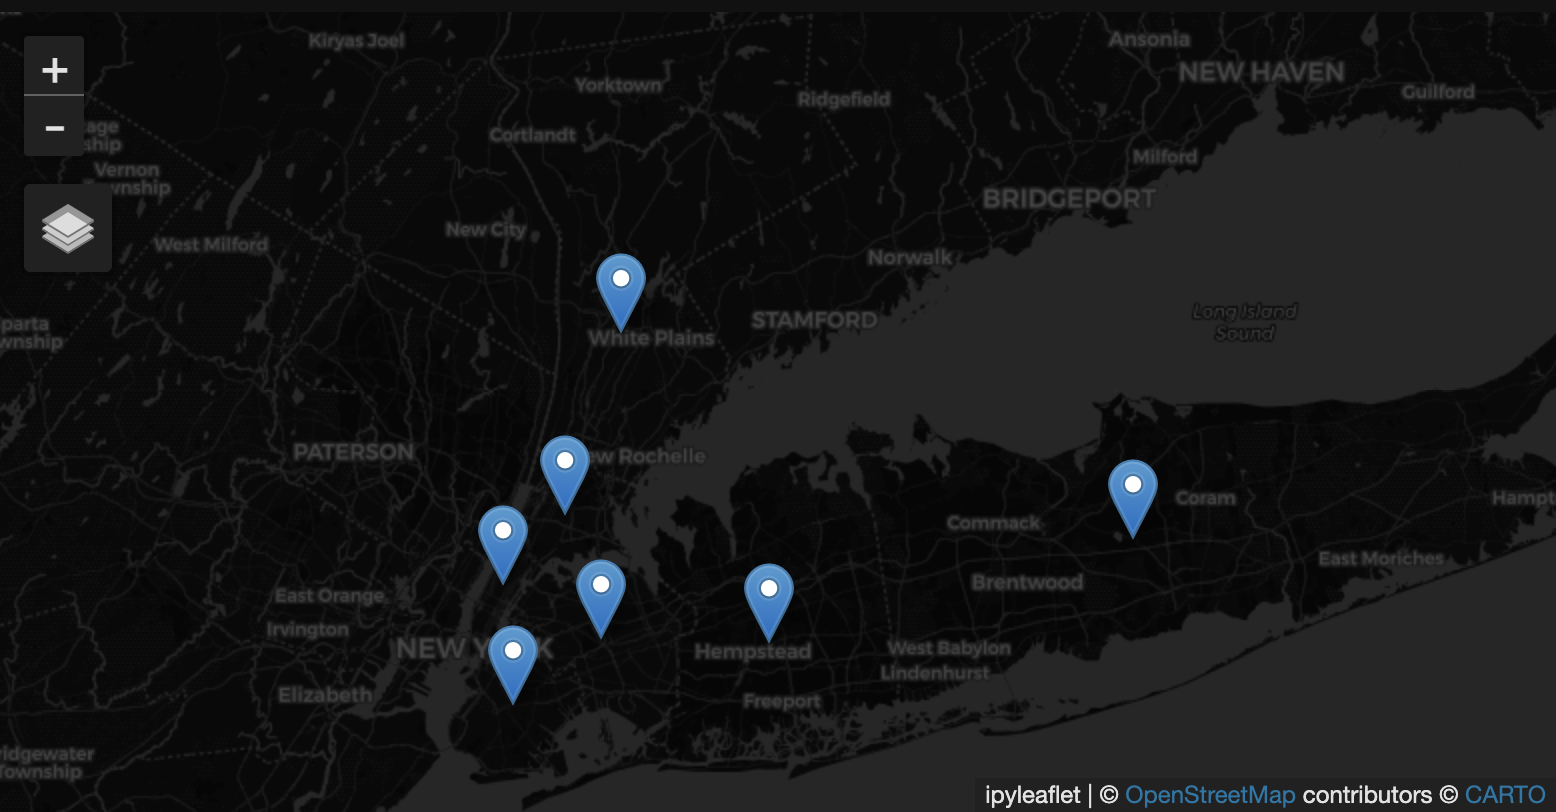
Finally, if you have installed the relevant dependencies, you can use the geodesic mapping utilities to visualize these features on a map using the following lines:
from geodesic import mapping
m = mapping.Map(center=[40.956961,-73.591128], zoom = 9)
m.add_feature_collection('pop_centers', feats)
m
If you use the map to navigate to the area of New York, you should see the features from our search: