Adding A GML Dataset
Problem
You want to use Boson to connect to a data source which is available in a GML (Geography Markup Language) format.
Solution
In this example, we will be using the US Census Bureau’s Centers of Population dataset, specifically at the county level. This dataset gives a point location for the population centroid of each county in the US in a CSV format. Files are available broken down by state, but we will be using the file for the entire US available at https://www2.census.gov/geo/docs/reference/cenpop2020/county/CenPop2020_Mean_CO.txt. We have converted this file to GML format for this example.
For the purposes of this demo, we have a copy of this file saved to a public bucket at gs://geodesic-public-data/CenPop2020_Mean_CO.gml but you might want to copy this file to your own cloud storage (e.g., S3 or Google Cloud Storage) to better replicate your use case. If you want to do this, you can easily substitute the url in the examples with your own cloud storage url.
Setup
First to do some initial setup. We start by importing geodesic:
>>> import geodesic
If you haven’t yet, you will need to authenticate geodesic using the following command:
>> geodesic.authenticate()
This process is covered in more detail in the Quickstart Guide.
We need to set the active project to ensure that our dataset is saved to the correct project. We do this using the uid of our desired project. If you do not know the uid, you can fetch a dictionary of existing project that you can access by running geodesic.get_projects(). Once you have the uid, you can set your active project like so:
>>> geodesic.set_active_project('cookbook-examples')
Creating The Provider
The geodesic python API provides a method, geodesic.Dataset.from_tabular_data() which makes adding GML datasets, as well as many other formats, extremely straightforward. To add our population centers dataset, we simply run:
>>> ds = geodesic.Dataset.from_tabular_data(
    name='uscb-pop-centers',
    url='gs://geodesic-public-data/CenPop2020_Mean_CO.gml',
    index_data=True,
    crs='EPSG:4326',
)
>>> ds.save()
Testing The Provider
Now to run a quick test to ensure that the provider is working. Let’s search run a simple search to check that features are returned
>>> ds.search()
This should return the first ten features from the CSV. If you are running in a jupyter notebook, this should appear in a widget like so:
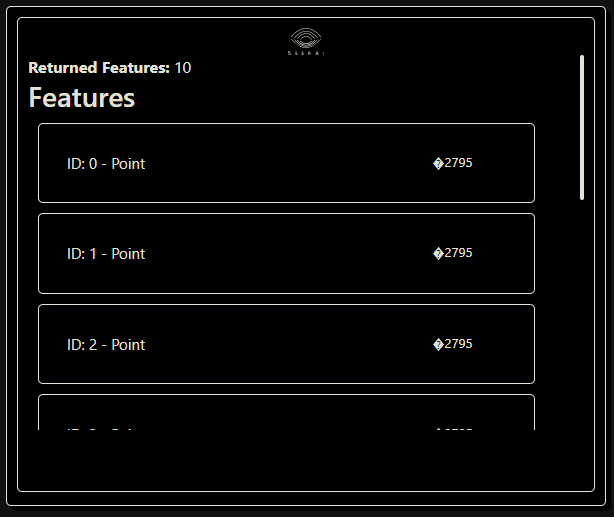
You can expand the individual features on the list to check that the correct data fields are included:
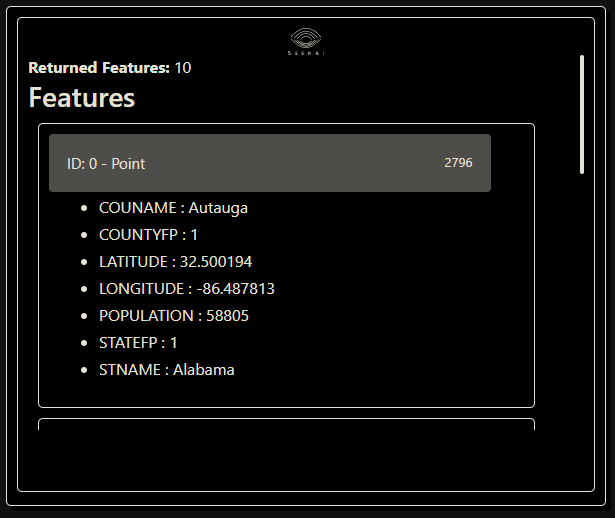
If you are missing the dependencies required to generate the jupyter widgets, or are not running in a notebook at all, the ds.search() method will return a dict containing the same information.
As a slightly less trivial example, let’s search for the counties in New York state with populations greater than one million:
>>> from geodesic import cql
>>> feats = ds.search(
    limit=10,
    filter=cql.CQLFilter.logical_and(
        cql.CQLFilter.eq('STNAME', 'New York'),
        cql.CQLFilter.gte('POPULATION', 1000000)
    )
)
>>> feats
This should return seven features:

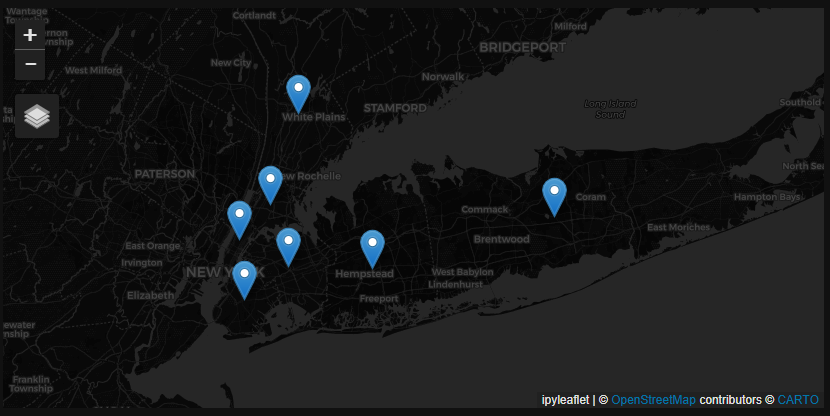
Finally, if you have installed the relevant dependencies, you can use the geodesic mapping utilities to visualize these features on a map using the following lines:
>>> from geodesic import mapping
>>> m = mapping.Map()
>>> m.add_feature_collection('pop_centers', feats)
>>> m
If you use the map to navigate to the area of New York, you should see the features from our search: