How We Think About Data
Why Spatiotemporal?
If you’re coming from a Geographic Information Systems (GIS) background, you’re probably familiar with the term Spatiotemporal. Spatiotemporal data are data that have both a location and a time. It simply means that we look at data holistically - not just in their small pieces. Virtually all data in the world are derived from a location and a time. If you consider the attributes that data can have, it essentially boils down to a list of properties or measurements, the location and time that these properties or measurements correspond to, and any connections to other data that they can have. Take for example a cell phone picture. Let’s assume the photo has a picture of a family at a landmark, such as a beach.

The photo might have been taken at sunset. If we look at this photo from a data perspective, it potentially has the following information:
The GPS location of where it was taken
The time it was taken
The RGB pixel content of the image
The make/model of the camera
The focal length of the camera
Numerous other pieces of metadata related to the photo
Imagine this photo was uploaded to a social media site - it’s now part of a graph; it’s connected to other data. The subjects of the photo have social relationships to other people, who have their own photos. Even something that’s “just” a photo contains much more information that can be used. The location data can associate it to a landmark, or add critical context to understand the photo’s content. The time information adds yet another dimension.
Sometimes the location and/or time are not relevent to the question we are trying to answer, but that’s okay - in that case it can just be ignored. If you start with spatiotemporal, you’re starting with almost everything.
Another reason we focus so strongly on spatiotemporal data is it’s a hard problem. Appropriately dealing with spatiotemporal data is not as simply as adding the latitude and longtude. Spatiotemporal data take many forms and formats. They come from from many different APIs and sources. The difficulty of working with spatiotemporal data itself is made significantly more challenging when those data are large in volume - Spatiotemporal Big Data is a whole other ball game.
But that’s where Geodesic comes in, when it comes to working with connected spatiotemporal data, it makes hard things easy, and impossible things possible. Geodesic is not a one-stop-shop for data science - it’s hardly the only toolset out there for data science. If you find Geodesic doesn’t have a capability you need, it’s likely because others solve the problem well. In these cases, we offer strong integration with others. Geodesic isn’t a platform you must be all in on in order to be effective - we do our best to integrate well with many of the data science tools already in your toolbelt. What Geodesic does do, however, is add many extra tools into your existing toolbelt to make solving solving spatiotemporal data challenges, including scaling up to planetary scale workloads, much simpler.
Geospatial Data
Let’s forget about time for a moment - if we ignore the time dimension, geospatial data can be broken down into two main categories: raster data and vector data. There are others too, such as triangulated irregular networks (TIN), network datasets such as road graphs, point clouds, videos, and others that are less common. In Geodesic, we mostly focus on raster data and vector, or feature, data. More specifically, we operate on tensor data, mostly in 4-dimensions and OGC-style geospatial Feature Data. Other data types can be stored and accessed, but most of the tools we have today focus on these two.
Raster Data
Raster data is data that is represented by values defined on a uniform grid, such as an image. Raster data can be composed of multiple bands, which represent different measurements. The photo above is an example of raster data with three bands: red, green, and blue (RGB). The RGB pixel values visually represent a picture, but in general, raster data doesn’t need to be visualized in order to be useful. Other examples of raster include satellite images (which may include non-visibile light, such as infrared), land cover/land use maps, weather data, digital elevation/terrain models, cost surfaces, and many more. If the information you are after is easily represented as a grid of numbers, raster may be the best representation. To work with raster data in Geodesic, it’s typically one of a few ways:
Numpy Arrays - these are a great way to represent raster data and our prefered way of working in Python-land
STAC Items - Rather than work with the the raw data directly (it’s often times very very large in size), a STAC Item is a way to reference external data, such as a GeoTiff in cloud storage. We will discuss STAC in more detail later.
GDAL Datasets - Geodesic makes heavy usage of GDAL throughout. Typically, you don’t need to, but the option is available if the need arrises. GDAL Datasets can be directly read into Numpy Arrays
PyTorch/TensorFlow/Other - Typically you start with a numpy array and convert, but when working with deep learning or similar this is likely how you’ll work with it.
We provide a few utilities in the Python API to work with raster data, but generally that’s the realm of Tesseract. See geodesic.raster for more details about local raster data. We’ll do a deep dive into STAC later.
Feature Data
Feature data is data represented by a planar geometry such as a point, linestring, polygon or combination of them optionally combined with other information called properties. A geospatial feature can represent many different things, such as an event that occurred on the earth, the footprint of a building and metadata about that building, a detection from a satellite image such as a field boundary, the location of a cell phone ping, and many many more. Mostly commonly, we represent them as GeoJSON, a popular format for geospatial vector data.
{
    "id": "null-island"
    "type": "Feature",
    "geometry": {
        "type": "Point",
        "coordinates": [0.0, 0.0]
    },
    "bbox": [0.0, 0.0, 0.0, 0.0],
    "properties": {
        "name": "Null Island",
        "population": 0
    }
}
The above shows a basic example of a geospatial feature in GeoJSON. We can make this geospatial feature a spatiotemporal
feature by adding either a datetime or start/end_datetime fields to represent when this feature exists in time.
Geodesic has tools for working with this that reduce some of the burden of working with the time dimension. In the
Python API, a new feature can be created/instantiated in many different ways:
>>> feature = geodesic.Feature(
...           id="null-island",
...           geometry='POINT(0.0 0.0)',
...           properties={'name': 'Null Island', 'population': 0}
...       )
>>> feature
{'type': 'Feature', 'geometry': {'type': 'Point', 'coordinates': (0.0, 0.0)}, 'bbox': (0.0, 0.0, 0.0, 0.0), 'properties': {'name': 'Null Island', 'population': 0} }
Note that the geometry can be provided in a few different ways:
A python
dictof GeoJSONWell Known Text/Binary (WKT/B) as above.
A shapely geometry
Anything that implements the
__geo_interface__convention
>>> geojson = geodesic.FeatureCollection.from_geojson('geojson.geojson')
>>> shp = geodesic.FeatureCollection.from_shapefile('shapefile.shp')
>>> fgdb = geodesic.FeatureCollection.from_file_geodatabase('features.fgdb', layer="my_layer")
>>> gpx = geodesic.FeatureCollection.from_gpx('my_strava_ride.gpx')
>>> other = geodesic.FeatureCollection.from_file('...', layer="my_layer")
Note that the from_file method can import any geospatial data that is supported by the
fiona Python library. For more details, see
geodesic.stac.
>>> ds = geodesic.get_dataset('srtm-gl1', project='global')
>>> fc = ds.query()
{'type': 'FeatureCollection', 'features': [{'type': 'Feature', 'id': 'N09E000', 'geometry': {'type': 'Polygon', 'coordinates': [[[-0.0001388888888888889, 8.999861111111112], [-0.0001388888888888889, 10.00013888888889], [1.000138888888889, 10.00013888888889], [1.000138888888889, 8.999861111111112], [-0.0001388888888888889, 8.999861111111112]]]}, 'bbox': (-0.0001388888888888889, 8.999861111111112, 1.000138888888889, 10.00013888888889), 'properties': {'units': 'meters'}, 'links':...
Note that the above result is actually a list of STAC items, which is a geospatial feature that’s associated with some other asset data. We’ll discuss this next.
Spatiotemporal Asset Catalog (STAC)
While we primarily deal with rasters and features, we don’t like to restrict things to just these types. We need a
truly data agnostic way to look at spatiotemporal data. There are many approaches to this, but we have chosen to settle
around the Spatiotemporal Asset Catalog (STAC) Spec. Above we mentioned how geospatial
feature data constists of a geometry and optional properties/attributes. STAC extends this concept by adding in
assets. An asset is some remote (or local) file or service that shares the same spatiotemporal extent as the
features. For a concrete example of this, consider the beach image above. If we represent the location of the image
extracted from the EXIF metadata as a geospatial feature, it might look something like this:
{
    "id": "null-island-beach"
    "type": "Feature",
    "geometry": {
        "type": "Point",
        "coordinates": [0.0, 0.0]
    },
    "bbox": [0.0, 0.0, 0.0, 0.0],
    "properties": {
        "name": "Family Photo",
        "aperture": "f/1.8",
        "datetime": "2022-07-01T07:01:31Z"
    }
}
This is a good way to represent the metadata associated with that image - as a geospatial feature. We can do better though and represent the entire thing as a STAC Item:
{
    "id": "null-island-beach"
    "type": "Feature",
    "geometry": {
        "type": "Point",
        "coordinates": [0.0, 0.0]
    },
    "bbox": [0.0, 0.0, 0.0, 0.0],
    "properties": {
        "name": "Family Photo",
        "aperture": "f/1.8",
        "datetime": "2022-07-01T07:01:31Z"
    },
    "stac_version": "1.0.0",
    "assets": {
        "image": {
            "title": "Family Photo",
            "descritpion": "a photo of a family at a beach",
            "type": "image/jpeg",
            "href": "https://images.unsplash.com/photo-1612392987205-c53f0200a175?ixlib=rb-4.0.3&ixid=MnwxMjA3fDB8MHxwaG90by1wYWdlfHx8fGVufDB8fHx8&auto=format&fit=crop&w=2670&q=80"
        }
    }
}
The above GeoJSON Feature has been augmented to become a STAC Item. Because a
STAC item can point to an arbitrary set
of things, it’s a completely data agnostic way of representing spatiotemporal data. The href can point to any place
that’s accessible, such as cloud storage or a URL. This URL could even be non-public as long as the system accessing it
has credentials to download to read the data. This is the first way in which Geodesic is decentralized. We can speak the
STAC language and access data that we do not control whatsoever. Users of Geodesic can provide credentials that
the platform can use to access remote content. Furthermore, each API that serves STAC doesn’t need to be controlled by
Geodesic either. Boson is capable of adding references to external APIs, including STAC APIs to make them look uniform
across the platform and to connect them to other information in Entanglement. Not everything can be represented as
a link to a file, but this fullfils a large number of use cases with geospatial data.
A STAC Item could point to, among other things:
A satellite image
a LiDAR point cloud
an IP video camera
a weather dataset in GRIB format
a GeoParquet file
a Zarr file
a georeferenced cell phone picture or oriented image
…
The list goes on.
STAC Items are usually organized into a STAC Collection. Collections are used to group Items that have similar sets of metadata, usually Items that have related assets. For example, the Sentinel-2 dataset consists of many individual images that cover the Earth for a given time window. Each Item in this case would be a single image from the dataset. Each of these images has similar metadata since all of the bands in each will be the same. The collection is used to describe what you can expect in each of the Items and their assets.
For everything that can’t be readily made into a STAC item, Geodesic offers a solution: Boson.
Boson: The Geospatial Service Mesh
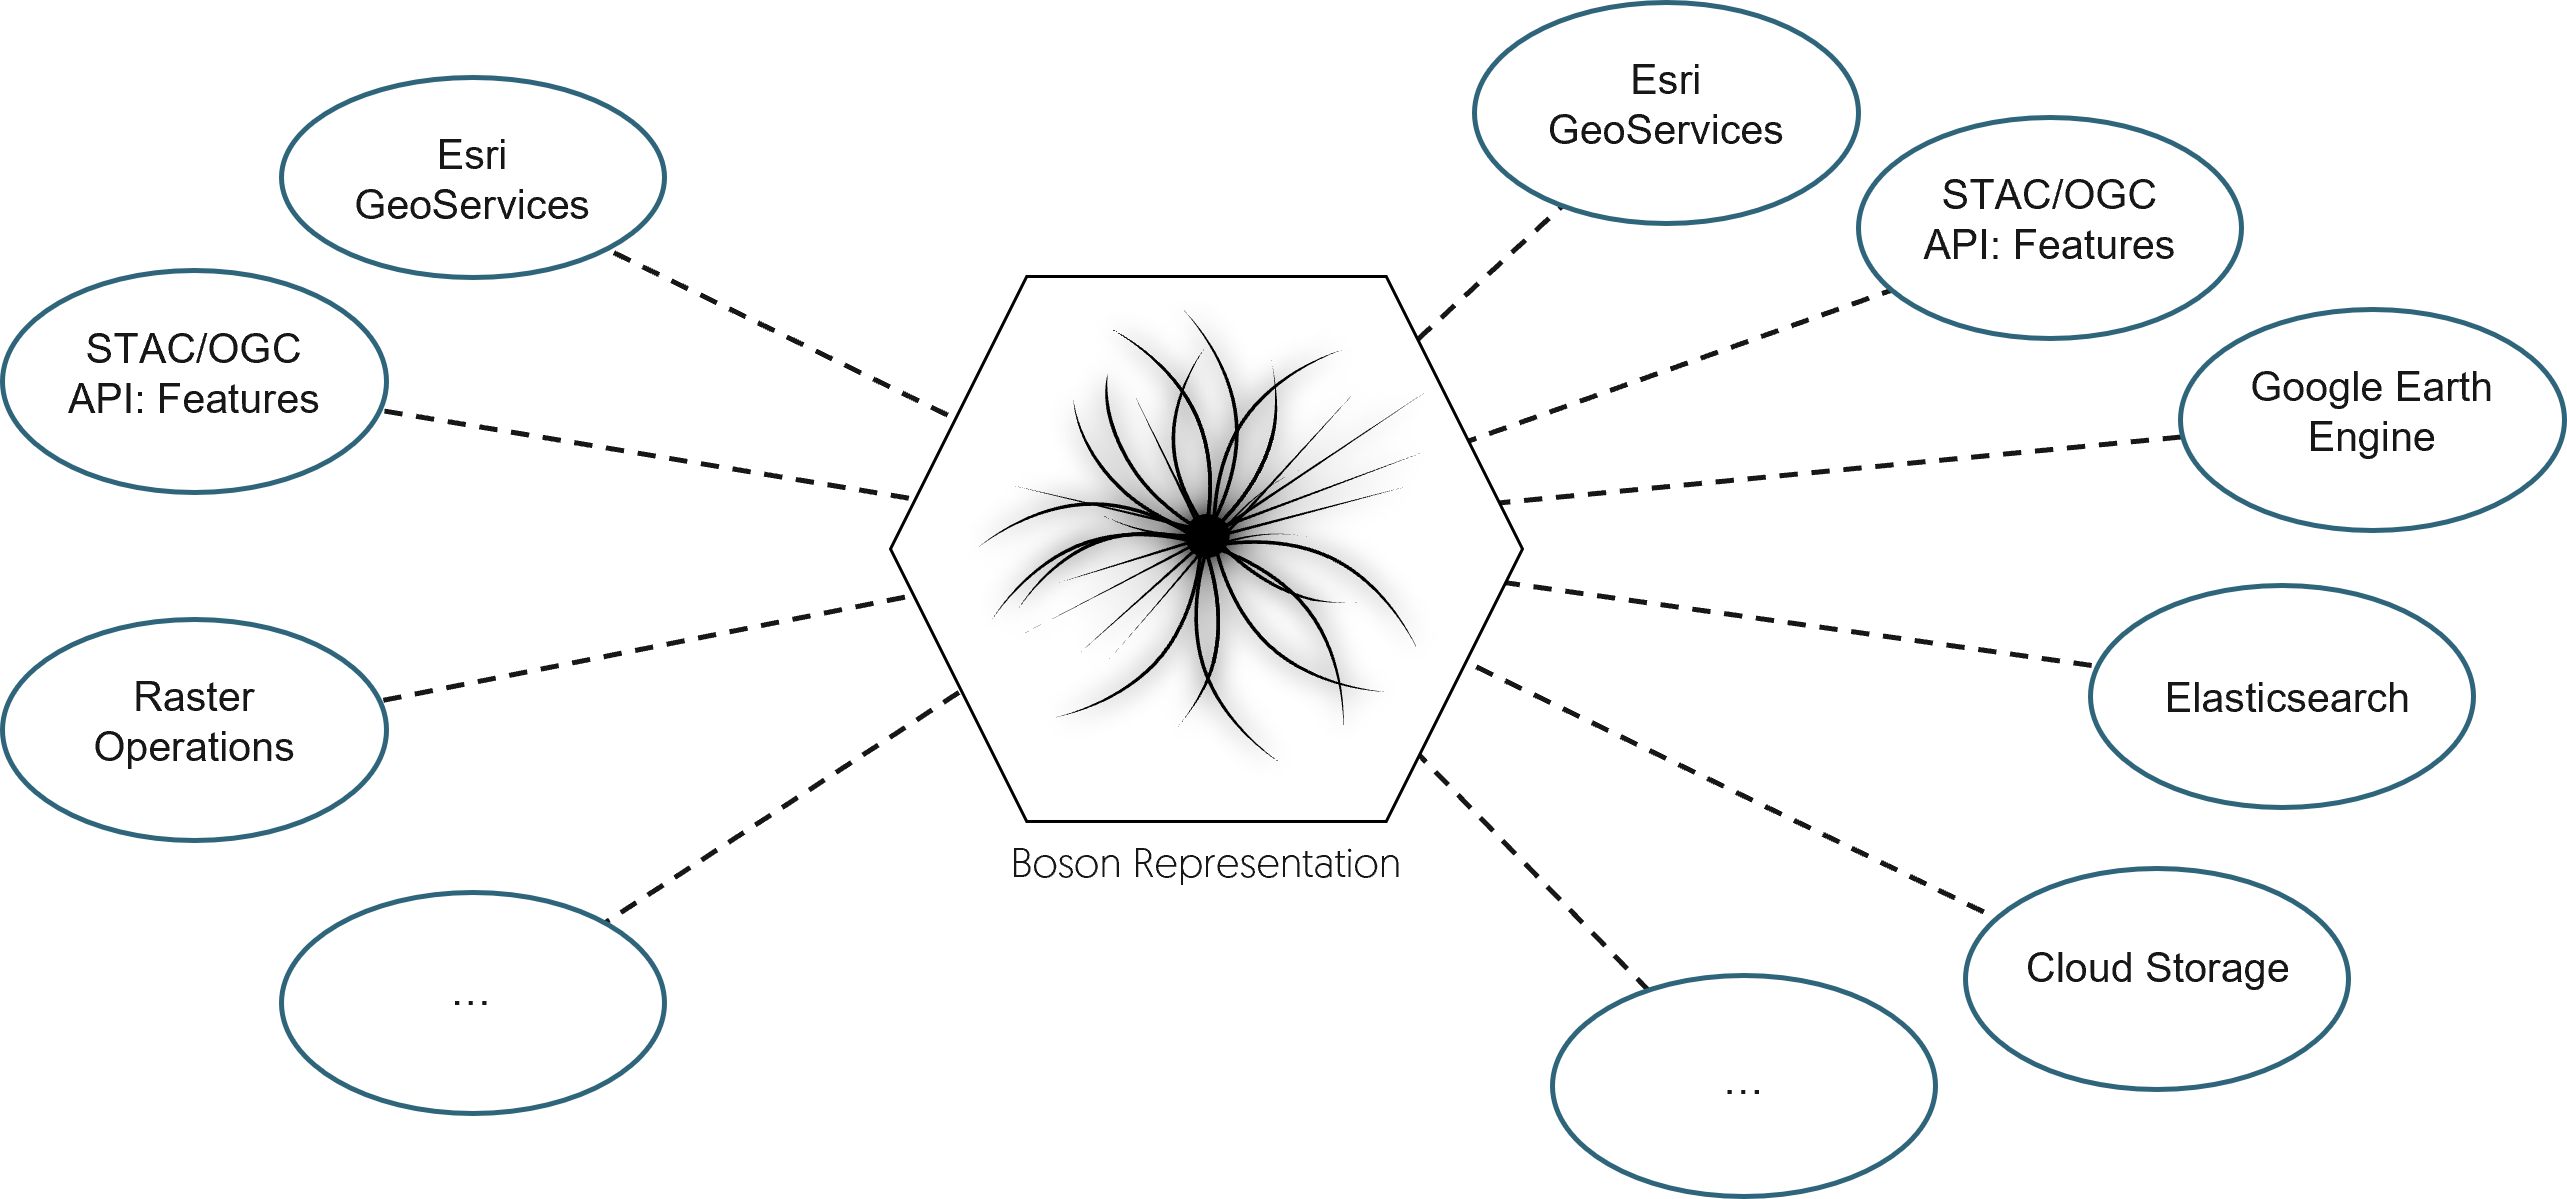
Boson can be thought of as a horizontally scalable geospatial service proxy; a client talks to Boson, Boson talks to a downstream service, and the downstream service returns results to Boson, Boson translates the results into the requester’s request format. In the end, the client doesn’t care where the data comes from as long as it looks like what it requested. Boson handles this negotiation for Features/STAC Items and Raster Data (with more types to come in the future) by abstracting the problem into three distinct pieces: Servicers, the Boson representation, and Providers. Making a request to Boson is done to one of several Servicer Endpoints. These could be STAC APIs, Esri GeoServices REST APIs, or a few others. This is how Boson EXPOSES data to the end user - you don’t need to know where the data comes from, only how you wish to receive it. The Service translates the client’s request into one or more Boson requests that represent the data the Servicer needs to respond to the client’s request. From this middle representation, Boson sends these requests to the Dataset’s Provider plugin, which performs the actual request against the remote endpoint and returns a response, again in the Boson representation. The Servicer translates the Boson representation back to the requested format and the request is completed.
Boson is able to perform this, including pagination, between any pair of servicer and provider that have implement the same Boson middle representation. This means I can request Google Earth Engine through an Esri GeoServices Image Service, or query for Esri Features through a OGC Features API. Since Boson is horizontally scalable, it can serve a massive number of requests (though it will always be bottlenecked by the downstream service’s limitations). In addition, it can also operate as a service mesh. For this, we run Boson as a sidecar container within our other services. Anything in Geodesic that needs to make scalable requests can run it’s own Boson. Rather than talking to some centralized host, it can speak to boson, which then sends the appropriate requests to the downstream, which itself could be Boson. So while geospatial data is extremely diverse and fragmented, in the Geodesic view of the world, it doesn’t have to be.
If we put everything above together, we can now describe the concept of a Dataset in Geodesic.
Datasets
Datasets are the way that any data is represented in the Geodesic Platform. A Dataset is simply
a collection of metadata that describe the remote data source as well as a small
configuration object that tells Boson how to access it, including any secure credentials required to access a downstream
API. A Dataset can have zero or more assets, just as a STAC Item/Collection can. You can, in some ways, think of our
Dataset as a superset of a STAC Collection. You’ll see references to assets scattered through the documentation,
especially Tesseract. Tesseract is a Data Fusion tool that builds new Datasets by transforming, combining, and
creating assets. When you query data from Boson, you are referencing a Dataset and one or more assets to
return some raster or feature data. For more information about Boson and Datasets see the next section
