Adding A Google Earth Engine Dataset
Problem
You want to use Boson to connect to a data source which is available on Google Earth Engine Data Catalog.
Solution
For this example, we will use MODIS Terra Thermal Anomalies & Fire Daily Global. This dataset provides information about the location of fires and thermal anomalies derived from the MODIS 4- and 11-micrometer radiances.
This dataset differentiates between fire, no fire and no observation. The data is available at 1km resolution and is updated daily.
Note
You will need to set up your Google Earth Engine credentials in the Credential Manager.
Setup
Start by seting up the basic geodesic workflow in python.
import geodesic
geodesic.set_active_project('cookbook-examples')
Creating The Provider
The Geodesic Python API provides a method, geodesic.Dataset.from_google_earth_engine() which
makes adding datasets from Google Earth Engine extremely straightforward. To add the MODIS Terra
Thermal Anomalies & Fire Daily Global dataset, all we need is the asset name from Google Earth
Engine. The first argument to the from_google_earth_engine() method is a user-specified name for
the dataset, and the second argument is the asset name. We simply run:
asset_name = "MODIS/061/MOD14A1"

ds = geodesic.Dataset.from_google_earth_engine(
    name='modis-terra-thermal-anomalies-daily',
    asset = asset_name,
    credential = 'google-earth-engine')
ds.save()
Testing The Provider
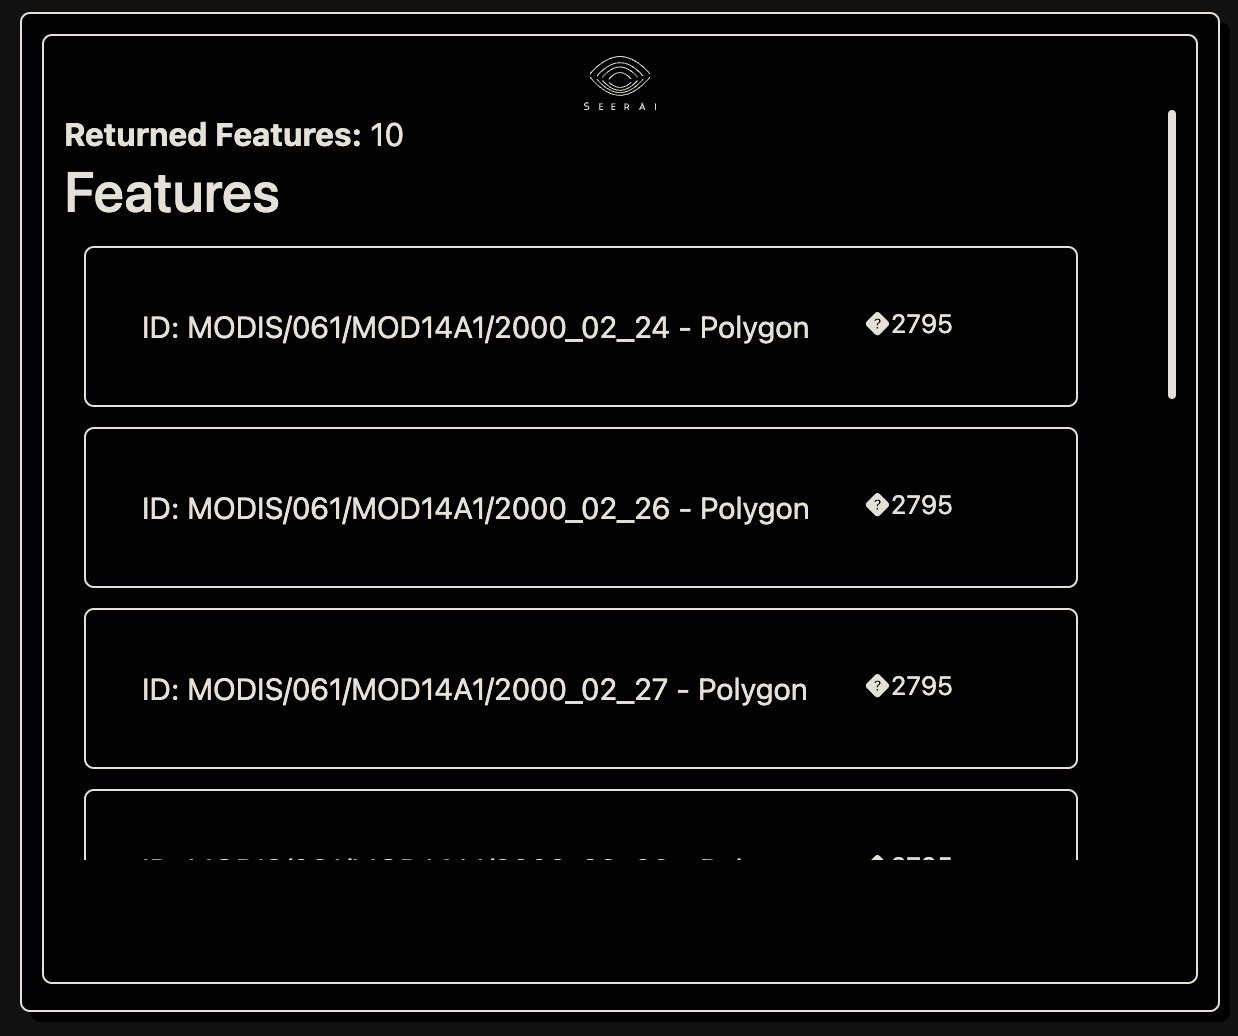
Now to run a quick test to ensure that the provider is working. Let’s run a simple search to check that features are returned
ds.search()
This should return the first ten features from the Google Earth Engine dataset. If you are running in a jupyter notebook, this should appear in a widget like so:
Creating a Pixel plot from the Dataset
We will use the geodesic.Dataset.get_pixels() method to plot fire mask band to observe the
2020 Mullen Fire in Wyoming. The
geodesic.Dataset.get_pixels() method requires us to specify the bounding box of the area we
want to visualize, and set the pixel size.
asset_bands =  [{
    "asset": "image",
    "bands": ["FireMask"]
}]
The resolution for the dataset is 1km, so we will set the pixel size to 1000m. However, we do not
need to know the native resolution of the dataset to use the geodesic.Dataset.get_pixels()
method. We can simply set the pixel size and the method will automatically resample the data to the
specified pixel size.
pixsize = [1000, 1000]
We will use the bounding box of the Mullen Fire in Wyoming as the area of interest, and set the datetime to the time of the fire.
bbox = (-106.642726, 40.853123, -106.024745, 41.272477)
dates = ('2020-09-20', '2020-09-30')
We can now pull the image data using Boson.
boson_output = ds.get_pixels(
    bbox=bbox,
    datetime=dates,
    bbox_crs="EPSG:4326",
    output_crs="EPSG:3857",
    asset_bands=asset_bands,
    pixel_size=pixsize,
)
The results can then be plotted using matplotlib.
import matplotlib.pyplot as plt
fig, ax = plt.subplots()
# create custom colormap to correspond to FireMask bitmask
# 3: Non-fire water pixel
# 4: Cloud (land or water)
# 5: Non-fire land pixel
# 6: Unknown (land or water)
# 7: Fire (low confidence, land or water)
# 8: Fire (nominal confidence, land or water)
# 9: Fire (high confidence, land or water)
cmap = colors.ListedColormap(['blue', 'white', 'green', 'lightgrey', 'gold', 'darkorange', 'darkred'])
bounds=[3,4,5,6,7,8,9]
pos = ax.imshow(boson_output[0], cmap=cmap)
# make a color bar
plt.colorbar(pos, cmap=cmap, boundaries=bounds, ticks=[3,4,5,6,7,8,9])
plt.show()
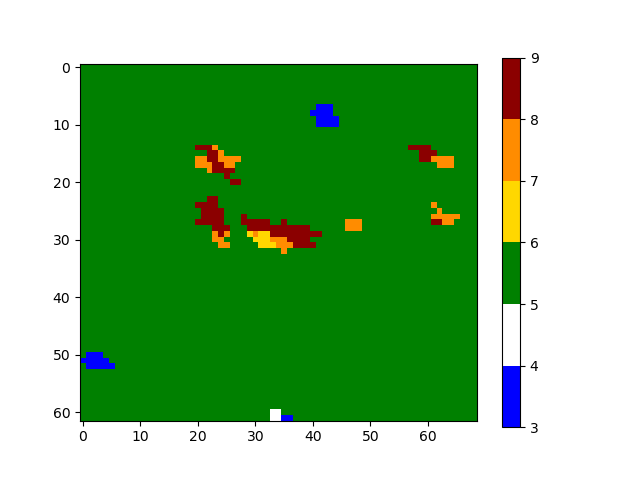
The plot clearly shows pixels of high confidence fire among non-fire land and water pixels in the area of the Mullen Fire in Wyoming.
